2. Plotting and reviewing the numerical results from a database entry
2.1. Use-case description
Sub-System: Python3 (possibly also Orange3 and Paraview) This use case describes how the user can visualize the output and plot the results of the DEM simulations.
Section |
Comment |
|---|---|
Use Case Name |
Plotting and reviewing the results |
Scope |
Plotting and visualization of all the necessary outputs of the simulations that have been committed to the database |
Level |
Sub-Level data submission |
Primary Actor |
Researchers who want to analyse data of DEM simulations, or create/re-do plotting (calibration is not included here, see separate use case) |
Stakeholders and Interests |
Researchers who perform DEM simulations or develop DEM models, experimentalists who conduct tests for calibration of DEM models, researchers that check which data is available in the database |
Preconditions |
Access to the metadata of the simulations and path to where the required data is stored |
Success Guarantee |
Paraview can visualize various quantities for a large number of particles. Python or the workflow tool (i.e. Orange3) can plot the results (just light-weight data directly stored in the database) |
Main Success Scenario |
All the required quantities are read by the workflow tool and plotted successfully, ParaView can read and visualize data |
Extensions |
- |
Special Requirements |
Data should be dumped during the simulation in order to check results; global and reference parameters should be logged to a file if needed for post-processing |
Technology and Data Variations List |
Metadata in *.json format, Standard outputs files of LIGGGHTS, pre-averaged output data or global and reference parameters/values |
Frequency of Occurrence |
may occur after a simulation run has been committed to the data base, or after larger simulation campaigns |
Miscellaneous |
- |
2.2. Workflow
Submitted data files can be visualized and analysed within the Orange3 environment. The files should be in the form of Excel (.xlsx), simple tab-delimited (.txt), comma-separated files (.csv) or URLs to be readable with the File widget in orange3 environment. Therefore the data with other formats, or discrete files can be read and rewritten into the above format using python. Depending on the data structure or the initial format of the available data (also dependent on the i/o file format of the DEM solver that has been used), the user might write his/her own script.
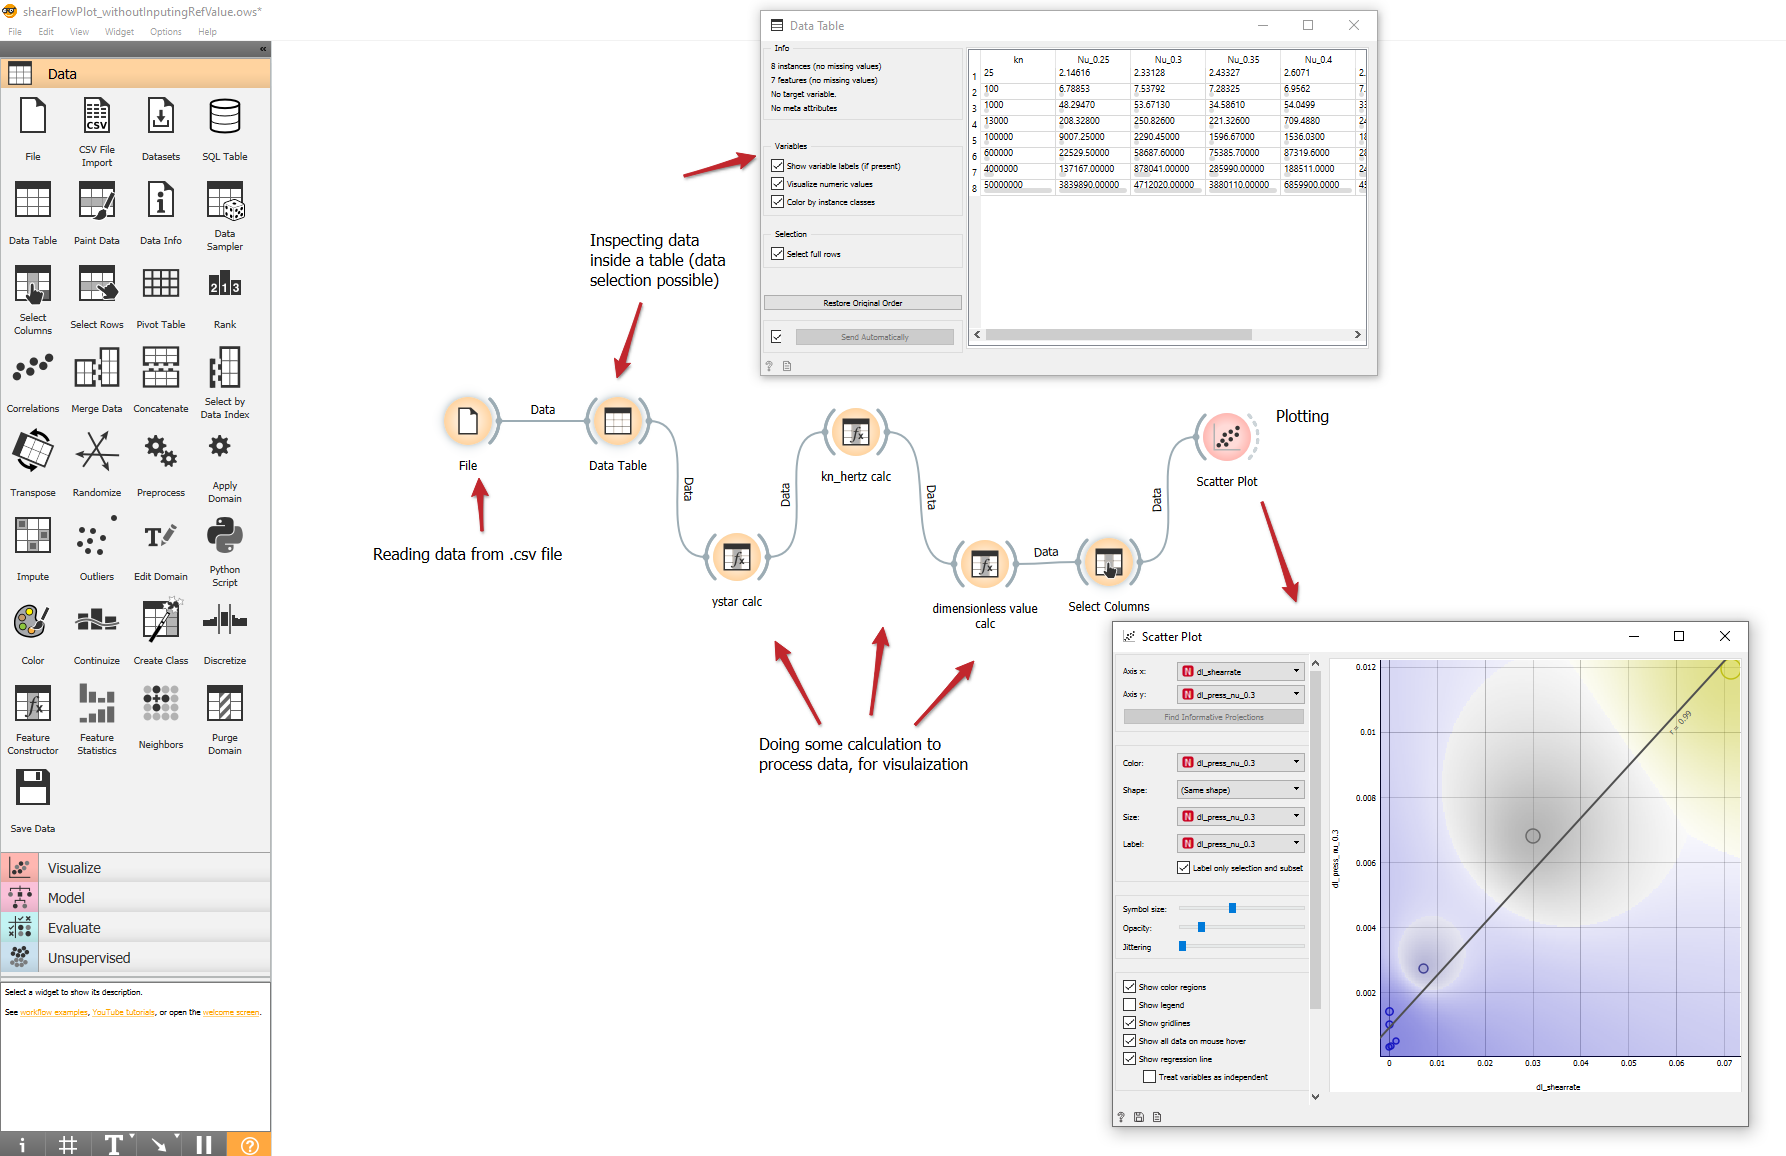
For example, the workflow below demonstrates an example to read data from a number of shear flow simulations, that are subsequently processed by applying some calculation widgets and visualized.